Robb Glenny, M.D.
Fluorescent Microsphere Resource Center
December 18, 1996

| [1] |
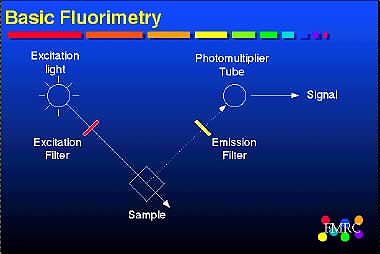
where Ø is the quantum efficiency, I0 is the incident radiant power, § is the molar absorptivity, b is the path length of the cell, and c is the molar concentration of the florescent dye . For dilute concentrations (§bc < 0.05), equation [1] reduces to the form:
| [2] |
If Ø, I0, § and b remain constant, the relationship between the fluorescent signal and dye concentration should be linear for dilute dye concentrations.
Because of these differences, the sensitivity of fluorescence is approximately
1000 times greater than absorption spectrophotometric methods.
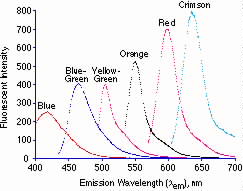
Fluorescent Spectra
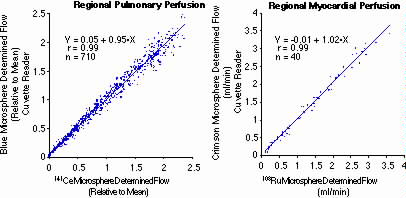
Validation vs. Radiolabeled Microspheres (Glenny, Bernard, et al. 1993)
Greatest advantage of fluorescent microspheres is that they can be used in
studies where radioactivity is not permitted.
Fluorescence vs. radioactivity
Advantages of fluorescence vs. absorption spectroscopy
Disadvantages of fluorescence
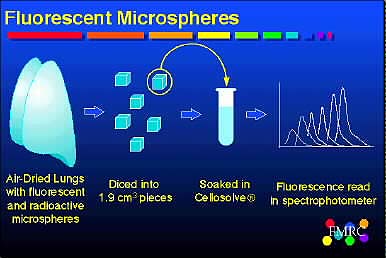
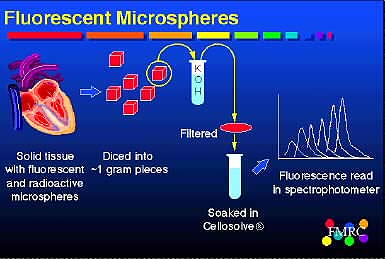
Fluorescent Microspheres
History and evolution
1963 - All radioactive work to present
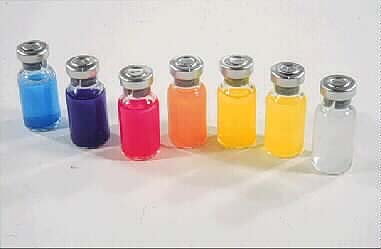
Physical properties of fluorescent microspheres
1981 - Gottlieb et al, Fluorescent microspheres
1991 - Kowalik et al, Colored microspheres
1993 - Glenny et al, Fluorescent microspheres
Sources of error
Many of the same potential errors as radiolabeled microspheres with some additional ones.
| Potential Error | Solution |
| Signal quenching | dilute sample, less spheres |
| Loss of microspheres when isolating | meticulous technique, centrifugation filters, single tube processing |
| Low signal:noise ratio | increase number of microspheres injected or sample size |
| Inaccurate solvent volumes | accurate pipettes, larger volumes, robotics |
| Dye stability | check in solvent |
| Background signal | choose appropriate colors |
![]()
Glenny, R. W., S. Bernard, and M. Brinkley. (1993). "Validation of
fluorescent-labled microspheres for measurement of regional organ perfusion."
J. Appl. Physiol. 74(5): 2585-2597.
References
Last modified: 2010-02-04 17:50:31 PST
Contact the FMRC
FMRC Home Page