Lung Composite Picture
Processing of fluorescent images.
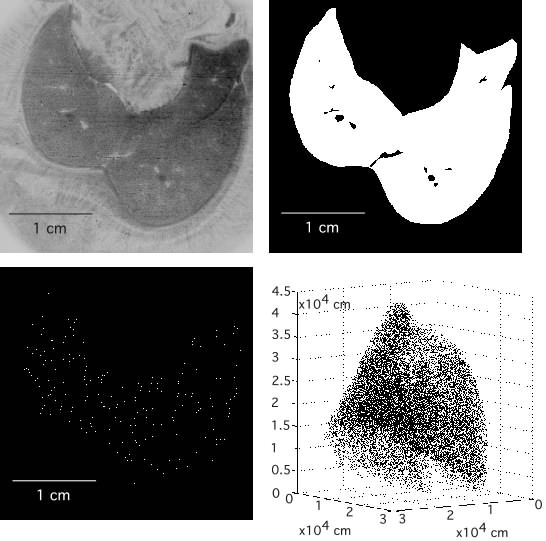
- A. 2000 x 2000 pixel outline image of rat lung en face.
- B. Bitmap image (black = 0 and white = 1) defining the spatial location of heart tissue
- C. Fluorescent image obtained with a specific excitation/emission filter pair to determine
individual microsphere location. Each point represents a yellow microsphere located by an x, y,
and z (slice) location. The spatial coordinates and cluster size of each microsphere are written to a text
file.
- D. Three-dimensional distribution of ~ 25000 red microspheres in a rat lung.
|