Materials:
- Potassium hydroxide pellets (224.4g KOH per 1000 ml H2O)
- 2% Tween-80™ (10 ml Tween-80 per 1000 ml potassium hydroxide)
- 100% isopropanol alcohol
- K2HPO4 powder (29.9 g K2HPO4 for 1000 ml buffer liquid)
- KH2PO4 powder (5.88 g KH2PO4 for 1000 ml buffer liquid)
- Organic solvent
Per Sample:
- 15 ml digestion solution
- 1.5 ml isopropanol
- 15 ml phosphate buffer
- organic solvent
Preparation:
- Digestion solution: Dissolve 224.44 g KOH in 1000 ml H2O by constant stirring. Add 10 ml 2% Tween-80 when the liquid has cleared (stable for 24 hours).
- Phosphate buffer: Dissolve 5.88 g KH2PO4 in 200 ml and 29.9 g K2HPO4 in 800 ml H2O. Mix two solutions together.
Work Routine
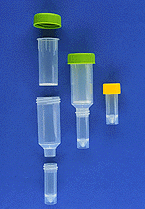
- Place each tissue sample in a separate first stage of the filtering device.
- Place first stage in KOH bath or separate containers of KOH.
- Layer 1.5 ml of isopropanol over top of each sample and seal first stage (Parafilm, tinfoil, and plastic wrap work well).
- Heat samples to 60° C until digested (2 - 4 hr).
- Suction digestate through first filter stage by negative suction and rinse with 15 ml of buffer.
- Dry sample by centrifugation at 4000 rpm for 5 min.
- Put first stage of filtering device into the second stage and attach third stage to bottom.
- Add one-half volume of organic solvent to the first stage, vortex for 20 seconds and let rest for 5 min.
- Add remaining half of organic solvent to the first stage and vortex for 20 seconds.
- Centrifuge organic solvent to third stage of filtering device by centrifugation (4000 rpm for 5 min.)
- Measure fluorescence in organic solvent.
Ten samples were digested and filtered per intructions. All fluid passing through the 10 filters was collected in a clean filtration flask. The collected fluid was filtered through a single Poretics® polycarbonate filter with 10 µm pores. The filter was placed in a sample tube, 1 ml of solvent added, and the fluorescent intensity in the solvent determined in our LS50B. The fluorescent signals for Blue-Green and Red were 54.0 and 59.5, respectively. These fluorescent signals corresponds to approximately 650 microspheres in our LS50B. The fluorescent dye was extracted from each filter device per the protocol and the dye concentrations measured with our LS50B.
The remaining 10 samples were digested using KOH and filtered with Poretic polycarbonate 10 µm filters. The fluorescent dye was extracted from each filter and the concentrations measured. All fluid passing through the 10 filters was collected in a clean filtration flask. The collected fluid was filtered through a single Poretics® polycaronate filter with 10 µm pores. The filter was placed in a sample tube, 1 ml of solvent added, and the fluorescent intensity in the solvent determined in our LS50B. The fluorescent signals for Blue-Green and Red were 3.3 and 0.3, respectively. These fluorescent signals are equal to those from blank solvent and corresponds to approximately 0 microspheres in our LS50B. The fluorescent dye was extracted from each filter and the dye concentrations measured with our LS50B.
Results: Fluorescent microspheres were not completely recovered by the Perkin Elmer filter devices. Relative to the radioactive counts, it appears as though the fluorescent signals from two of the Perkin-Elmer filtering devices were too low. See graph below.
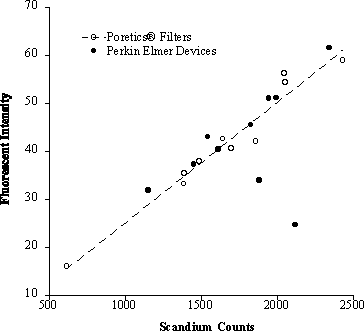
Conclusion: We are concerned that the current Perkin Elmer filtering devices are not an acceptable method to isolate fluorescent microspheres from solid tissue.